Properties Sold: 15
Address Sales Price BR BA Sq.ft.$/Sq.ft Yr.Blt.MLS# Sold Date Days on Mkt.
9 Pepper Tree LN $1,200,000 3 3.00 2,546 $471.33 2002 PV13050340 7/10/13 98
22 Hillcrest Meadows $1,306,000 4 3.00 2,733 $477.86 1991 PV13165639 9/23/13 38
5417 Middlecrest RD $1,500,000 4 5.00 3,100 $483.87 1960 PW13113556 8/16/13 22
28876 King Arthur CT $1,600,000 4 4.00 4,104 $389.86 1986 SB13120570 8/27/13
30 Via Malona $1,699,000 5 5.00 4,189 $405.59 1990 PV13087195 9/04/13 117
29 Via Malona $1,555,000 4 4.00 3,488 $445.81 1990 RS13110395 8/30/13 100
14 Country LN $1,700,000 4 4.00 3,312 $513.29 1983 PV13066929 7/08/13 36
12 Via Porto Grande $1,850,000 5 5.00 4,632 $399.40 1990 PV13081312 7/23/13 81
5408 Valley View RD $1,917,000 5 6.00 4,792 $400.04 1983 PV13094288 7/30/13 59
32 Via Costa Verde $1,960,000 5 6.00 5,630 $348.13 1990 PV13065638 7/12/13 91
17 Santa Rosa $2,100,000 4 4.00 3,286 $639.07 1999 PV13103984 8/09/13 24
25 Hillcrest Manor $2,251,500 4 5.00 4,696 $479.45 1998 SB13100849 8/28/13 76
8 Hillcrest Manor $2,275,000 5 5.00 4,586 $496.08 1999 PV13132155 8/20/13 11
45 Santa Cruz $2,650,000 4 5.00 4,511 $587.45 2001 PV13051727 9/24/13 181
5858 Ocean Terrace DR $2,998,000 5 5.00 5,350 $560.37 1988 PV13141390 9/16/13 182
Average $1,904,100 4.0 4.60 4,064 $473 88
Average Sales Price of homes sold during 3rd quarter: $ 1.9 million
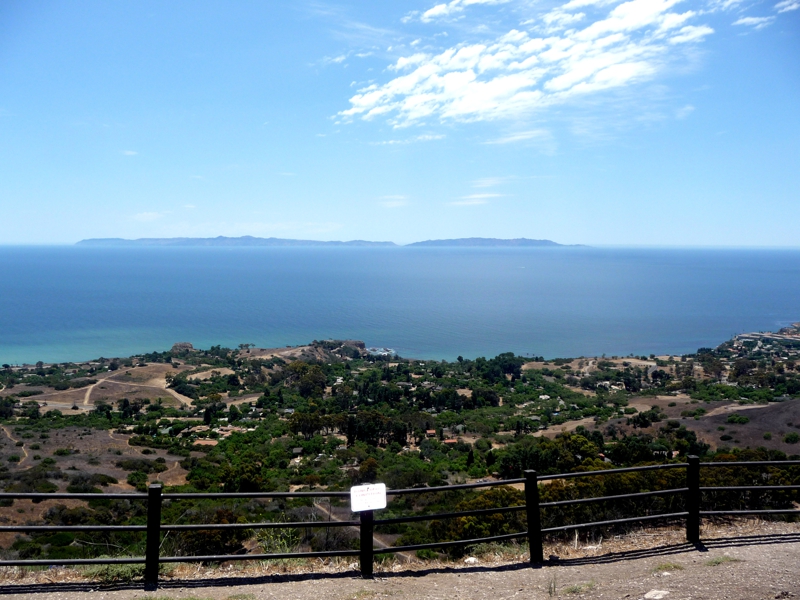
View from La Cresta area – Del Cerro Park
Number of Properties listed for sale as of 9/30/13: 10 ( 2 months of inventory based on the average number of homes per month sold in the quarter of 5) Click Here for Current Properties for Sale

|
|
Average List Price at 9/30/13: $ 2.3 million
Average Price per Sq. Ft. for Properties Sold during 3rd Qtr: $469 per sq. ft., a 7% increase from the prior years comparable quarter.

|


For more information about Palos Verdes and South Bay Real Estate and buying and selling a home on the Palos Verdes Peninsula, visit my website at https://www.maureenmegowan.com . I try to make this the best real estate web blog in the South Bay Los Angeles and the Palos Verdes Peninsula. I would love to hear your comments or suggestions.