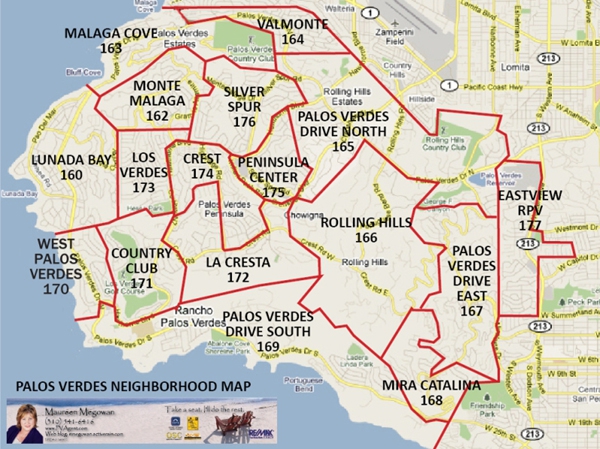
The Eastview area of Rancho Palos Verdes ( area 177 in map below) had the following real estate market activity for single family residences during the 2nd Quarter of 2011 :
Properties Sold: 14
Address Sales Price BR BA Sq.ft. $/Sq.ft Yr.Blt. MLS# Sold Date Days on Mkt.
28606 Mount Rose RD $583,000 4 2.00 1,624 $358.99 1974 S11043935 6/24/11 27
28700 Mount Sawtooth DR $600,000 3 2.00 1,723 $348.23 1973 S643158 5/27/11 34
2091 Jaybrook DR $610,000 3 3.00 1,840 $331.52 1950 S11036329 5/19/11 40
27604 Tarrasa DR $612,000 4 2.00 1,790 $341.90 1960 S651259 5/27/11 71
1945 Peninsula Verde DR $615,000 4 3.00 2,045 $300.73 1970 V10102658 5/16/11 203
1837 Avenida Feliciano $640,000 3 3.00 2,110 $303.32 1960 V10126260 6/14/11 162
1992 Jaybrook DR $655,000 4 4.00 2,366 $276.84 1950 N10121795 4/11/11 105
1814 Redondela AV $665,000 4 2.00 1,790 $371.51 1960 S11026614 6/24/11 110
2160 Dorado DR $689,000 3 3.00 2,115 $325.77 1956 T11029954 4/06/11 31
28325 Pontevedra DR $720,000 3 2.00 1,860 $387.10 1957 V11011518 4/18/11 60
1972 Redondela DR $725,000 4 3.00 2,382 $304.37 1960 S11051345 6/21/11 54
2153 Van Karajan DR $742,500 4 3.00 2,482 $299.15 1963 P776804 6/02/11 25
2040 Upland ST $770,000 4 3.00 2,207 $348.89 1959 V10123798 4/26/11 137
27855 S Montereina DR $780,000 4 3.00 2,449 $318.50 1959 S11040648 6/15/11 36
Properties for Sale as of 6/30/11: 16

Average List Price at 6/30/11: $ ,8 million
Average Sales Price of homes sold during 2nd quarter: $ .7 million
Average Price per Sq. Ft. for Properties Sold during 2nd Qtr: $ 330 per sq. ft.
Properties sold at an average of 99% of List Price

For more information about Palos Verdes and South Bay Real Estate and buying and selling a home on the Palos Verdes Peninsula, visit my website at https://www.maureenmegowan.com . I try to make this the best real estate web blog in the South Bay Los Angeles and the Palos Verdes Peninsula. I would love to hear your comments or suggestions.


