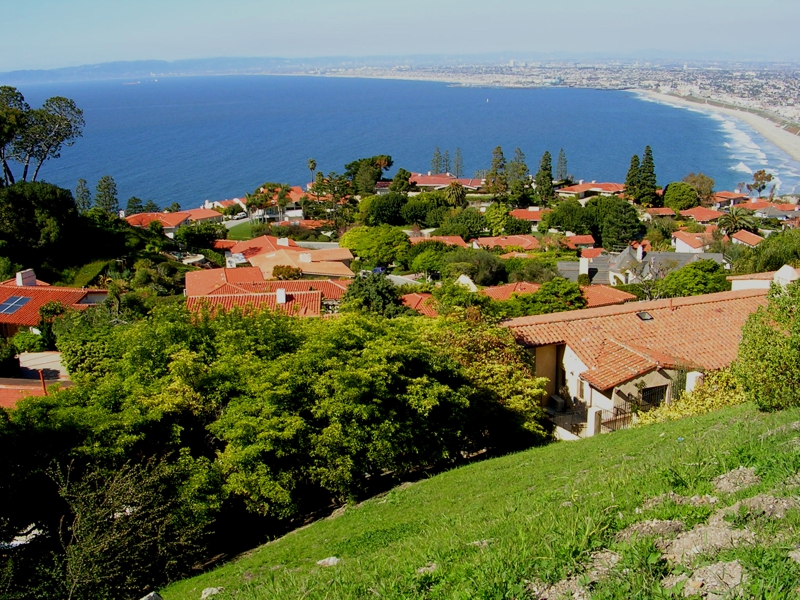
The number of homes listed for sale in the City of Palos Verdes Estates during 2011 has been relatively steady, averaging 78 homes, but is down about 25% compared to a year ago. The average number of homes sold per month during this same period has also been very steady, averaging 15 sales per month, however the average monthly number of homes sold during the last 2 months has only been about 9. This equates to approx. 8 months of inventory.

|
|
|

The average price per square foot over the last 3 months has been $507 per sq. ft., a decrease of 6% over the comparable period last year. The overall market appears to have stabalized. This market has not been nearly as impacted by the foreclosure sales which have severely affected inland markets.

The following is a list of the 8 homes sold during the month of October 2011:
Address Sales Price Bd Bth Sqft $/Sq Yr. Built ML# Sold Date Days on Market
1636 Espinosa CR $875,000 3 2.00 1,389 $629.95 1954 V11025172 10/07/11 223
2505 Via Rivera $975,000 3 3.00 2,387 $408.46 1954 V10076701 10/28/11 468 1015 Via Palestra $1,076,000 3 2.00 2,034 $529.01 1958 V11098638 10/28/11 83 2621 Via Valdez $1,280,000 5 3.00 3,357 $381.29 1973 S11087187 10/07/11 75 1377 Via Romero $1,550,000 4 4.00 4,579 $338.50 1978 V11064594 10/07/11 121 261 Rocky Point RD $2,950,000 5 4.00 3,500 $842.86 1956 S11115742 10/14/11 6 968 Via Rincon $1,500,000 4 3.00 2,256 $664.89 1962 V11032884 10/21/11 221 405 Via Colorin $925,000 3 2.00 1,760 $525.57 1952 V11092915 10/21/11 43 Average $1,391,375 4.0 2.90 2,658 $524 155
|
For more information about Palos Verdes and South Bay Real Estate and buying and selling a home on the Palos Verdes Peninsula, visit my website at https://www.maureenmegowan.com . I try to make this the best real estate web blog in the South Bay Los Angeles and the Palos Verdes Peninsula. I would love to hear your comments or suggestions.


