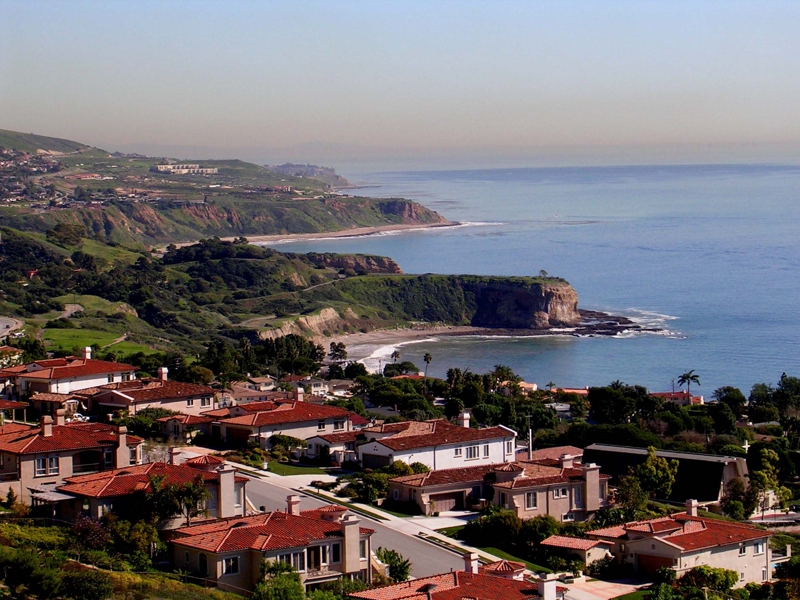
The real estate market in the City of Rancho Palos Verdes has been active, with sales strong and inventory down . The level of inventory of homes for sale of 81 homes is down significantlywith the average number of homes for sale having decreased approx. 43%compared tothe end ofAugust last year. Sales over the last 3 months have averaged31 homes, which is a decrease of 11% from the comparable quartrer last year.There are39 homes in escrow at the end of July.Click here for a current search of homes for Sale in Rancho Palos Verdes.

|
2818 Colt RD $1,000,000 3 3.00 2,584 $387.00 1979 V12050923 8/03/12 82
4121 Miraleste DR $1,065,000 4 3.00 2,374 $448.61 1954 12576427 8/29/12 224
6520 Via Lorenzo $1,110,000 3 3.00 2,375 $467.37 1936 V12047554 8/03/12 109
30035 Grandpoint LN $1,200,000 5 3.00 3,177 $377.71 1969 V12003837 8/01/12 190
2615 Sunnyside Ridge RD $1,250,000 4 3.00 2,822 $442.95 1956 N11028745 8/29/12 515
3420 Coolheights $1,100,000 4 3.00 2,244 $490.20 1969 V12078811 8/03/12 41
6519 Sandy Point CT $995,000 4 4.00 3,036 $327.73 1987 V12062119 8/30/12 111
32227 Phantom DR $1,150,000 4 2.00 2,054 $559.88 1963 V12079683 8/23/12 58
108 Spindrift DR $1,300,000 2 2.00 1,669 $778.91 1953 S11078405 8/31/12 383
31986 Emerald View DR$1,800,000 5 7.00 12,000 $150.00 2011 S11107833 8/13/12 602
7460 Alida PL $1,929,000 6 6.00 4,959 $388.99 1999 V12095082 8/30/12207
29916 Avenida Magnifica $985,000 4 3.00 2,828 $348.30 1962 H12025375 8/17/12 249
29413 Seaspray DR $1,185,000 4 3.00 2,968 $399.26 1966 V12079097 8/21/12 88
31018 Marne DR $3,815,000 5 6.00 6,002 $635.62 2004 V12060693 8/31/12 102
68 Sea Breeze AV $1,599,000 4 4.00 3,727 $429.03 1999 V12041712 8/30/12148
5918 Ocean Terrace DR$2,500,000 5 4.00 5,314 $470.46 1987 S12068496 8/16/12 295
6334 Rio Linda DR $850,000 3 2.00 1,434 $592.75 1962 V12088410 8/21/12 17
5650 Sunmist DR $775,000 4 3.00 2,539 $305.24 1965 12596091 8/31/12 15
6104 Scotmist DR $981,000 4 3.00 2,553 $384.25 1973 V12073409 8/10/12 3
28615 Coveridge DR$1,120,000 5 3.00 2,265 $494.48 1972 S12083973 8/22/12 29
5008 Golden Arrow DR$865,000 3 3.00 1,896 $456.22 1967 S12063962 8/03/12 38
26642 Honey Creek RD$955,000 4 3.00 2,246 $425.20 1965 S12048509 8/01/12 84
27525 Larchbluff DR $1,035,000 5 3.00 2,386 $433.78 1965 S12054564 8/08/12 41
27017 Silver Moon LN $1,150,000 4 3.00 2,794 $411.60 1967 S12038944 8/29/12 121
26851 Grayslake RD $733,000 3 2.00 1,395 $525.45 1960 R1203742 8/31/12 19
5314 Montemalaga DR$750,000 3 2.00 1,780 $421.35 1962 S12057435 8/15/12 10
26608 Fond Du Lac RD $825,000 4 2.00 1,682 $490.49 1957 V12002940 8/16/12 197
5746 Wildbriar DR $935,000 4 2.00 2,479 $377.17 1961 V12075216 8/23/1229
5916 Clint PL$1,101,000 4 2.00 2,435 $452.16 1960 V12079385 8/21/12 52
5900 Mossbank DR $1,275,000 4 4.00 2,966 $429.87 1979 S12070336 8/06/12180
1954 W General ST $525,000 3 2.00 1,378 $380.99 1955 S12032539 8/31/12 124
2029 Trudie DR $551,000 2 2.00 1,467 $375.60 1950 V12060299 8/28/12 101
2156 W Crestwood ST $622,000 3 2.00 1,298 $479.20 1955 V12083499 8/27/12 37
2024 Redondela $665,000 4 2.00 1,790 $371.51 1962 V12062863 8/14/12 90
1928 Avenida Estudiante $680,000 4 2.00 1,864 $364.81 1959 S12077968 8/24/12 0
Average $1,153,600 4.0 3.00 2,822 $436133


|
|
It has been taking an average of 3 to 4 months to sell a home in Rancho Palos Verdes. Properties are selling for
approx. 93% of original list price.
|

|
The average list price of homes offered for sale had trended downwardsfor the first 5monthsof the year, but then picked up again the last3 months,but is approx.8% lower thanthe the comparable 3 month period last year.The average price of homes sold has been much lower than the average list price of homes but did increase in August..

|
|
Combined with record low interest rates, now is an excellent time to consider buying a home.
|
For more information about Palos Verdes and South Bay Real Estate and buying and sellinga homeon the Palos Verdes Peninsula, visit my website at https://www.maureenmegowan.com. I try to make this the best real estate web blog in the South Bay Los Angeles and the Palos Verdes Peninsula.I would love to hear your comments or suggestions.


