The Crest area of Rancho Palos Verdes and Rolling Hills Estates( area 174 in map below )had the following real estate market activity for single family residences during the 2nd Quarter of 2013 :
Properties Sold: 14
Address Sales Price BR BA Sq.ft.$/Sq.ft Yr.Blt .MLS# Sold Date Days on Mkt.
5561 Mistridge $900,000 4 3.00 2,292 $392.67 1967 P839531 4/03/13 111
29402 Indian Valley RD $950,000 4 3.00 2,056 $462.06 1972 SB13050097 5/16/13 26
28624 Coveridge DR $968,000 4 3.00 2,135 $453.40 1972 PV13028081 4/23/13 40
29422 Indian Valley RD $990,000 4 3.00 2,051 $482.69 2002 PV13049357 6/28/13 100
5661 Scotwood DR $1,060,000 4 3.00 2,374 $446.50 1966 PV13050500 5/10/13 48
28703 Leacrest DR $1,060,000 5 3.00 2,265 $467.99 1971 SB13033250 4/17/13 183
29500 Oceanport RD $1,085,000 4 3.00 2,052 $528.75 1964 SB13059971 6/27/13 21
5 Mela LN $1,125,000 3 4.00 3,017 $372.89 1979 PV13045065 4/26/13 38
29257 Whitley Collins DR $1,130,000 4 4.00 2,582 $437.65 1964 PV13056855 6/07/13 82
28706 Circlet DR $1,268,800 4 3.00 2,741 $462.90 1970 PV13027505 4/01/13 9
5705 Whitecliff DR $1,300,000 5 3.00 2,516 $516.69 1963 PV13083474 6/18/13 17
28733 Covecrest DR $1,450,000 4 3.00 2,952 $491.19 1966 PV13044467 4/09/13 5
28805 Covecrest DR $1,562,888 4 5.00 2,938 $531.96 1967 12172976 4/30/13 40
29137 Covecrest DR $1,675,000 4 4.00 3,141 $533.27 1966 PV13088159 5/29/13 1
Average $1,180,335 4.0 3.40 2,508 $472 52

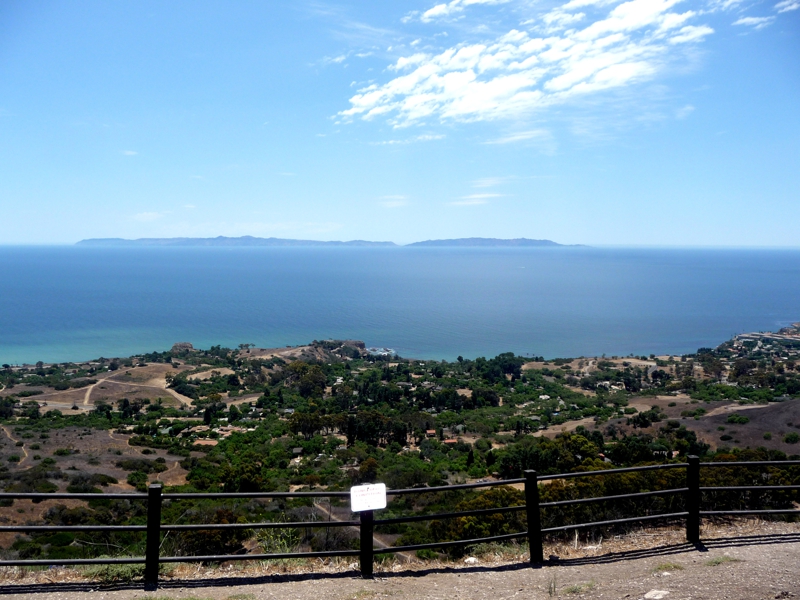
View from La Cresta area – Del Cerro Park
Number of Properties listed for sale as of 6/30/13: 5 ( 1 month of inventory based on the average number of homes per month sold in the quarter ) Click Here for Current Properties for Sal

|
Average List Price at 6/30/13: $ 1.2 million
Average Price per Sq. Ft. for Properties Sold during 2nd Qtr: $472 per sq. ft., a 14% increase over last years comparable quarter.

|
Properties Sold for an Average of 101% of list price during the quarter:

For more information about Palos Verdes and South Bay Real Estate and buying and selling a home on the Palos Verdes Peninsula, visit my website at https://www.maureenmegowan.com . I try to make this the best real estate web blog in the South Bay Los Angeles and the Palos Verdes Peninsula. I would love to hear your comments or suggestions.


